Accuracy and repeatability of wound measurement
Study: Assessment of accuracy and repeatability on wound models of a new hand-held, electronic wound measurement device
Mark A Nixon, MBChB; Thomas R Rivett, BE; Brent S Robinson, PhD. ARANZ Medical, Christchurch, New Zealand
Aim
To assess the wound measurement accuracy and repeatability of the Silhouette® hand-held, electronic wound measurement device on wound models of known dimensions.
Method
Three different raters made five repeated measurements on four different wound models.
The wound models included:
1. A disk on a flat sheet, the simplest case (‘flat’)
2. A disk on a cylinder, representing a superficial wound on a limb (‘cylinder’)
3. A section of a concave hemisphere, representing a pressure ulcer (‘concave’)
4. A section of a convex hemisphere, representing a superficial wound on a heel (‘convex’)
For the purpose of this study, all the wound models were chosen to have a circular outline with a diameter of 4 cm, to aid with the pooling of data. A photograph of the wound models is shown in Figure 1.
The flat and cylindrical models were constructed by printing circles on paper sheets and mounting them on a flat block of medium density fiberboard (MDF) and an 8.8 cm in diameter cylinder respectively. The concave and convex models were milled from a block of acetal, a dimensionally stable plastic. Nominal linear tolerances for all models, verified with digital calipers, were ± 0.04 mm (± 0.1%) leading to areal and volumetric tolerances of ± 0.2% and ± 0.3% respectively.
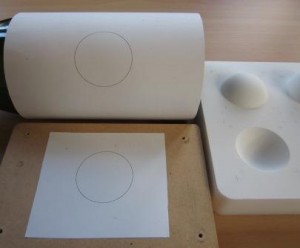 Figure 1
|
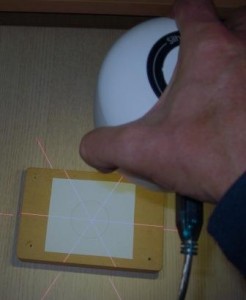 Figure 1a |
Figure 1: Left photograph shows the four wound models – disk on a cylinder (top left), disk on a flat sheet (bottom left) and convex and concave sections of a hemisphere (top and bottom right respectively). Figure 1a shows the device capturing data from the flat model.The dimensions of the wound models are summarized in Tables 1 and 2.

Table 1
Table 1: Nominal wound model dimensions: Area and perimeter
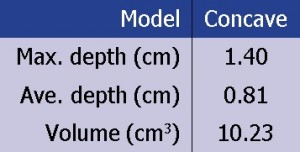
Table 2
Table 2: Nominal wound model dimensions: Depth and volume (concave model)
All images were captured with the camera held over the wound models by hand, as would be the case in a clinical setting. All the raters were blinded to the results as they were being captured.
Of the three raters, two were familiar with the device, namely raters 1 and 2, whereas rater 3 was not familiar with the device, received only five minutes training prior to data capture and collected the data unsupervised.
Room lighting was a mixture of indirect sunlight and fluorescent with light levels ranging between 70 to 220 lux.
How are wound dimensions defined by the device?
Concave wounds
For concave wounds, i.e., wounds with a cavity (or cavities), certain assumptions need to be made in order to calculate the various quantities (such as wound area, depth and volume) associated with the wound. For example, in order to calculate a volume, a closed region needs to be defined. How the device defines these measurements, in a way that is both clinically meaningful and mathematically reasonable, is illustrated in Figure 2.
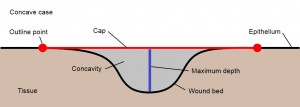
Figure 2
Figure 2: A cross-section through a concave wound. The area is defined as that region of an elastic ‘cap’ that is stretched over the concavity and that is circumscribed by a user-drawn outline. The outline is indicated by the two red dots, and the area by the red line. Typically, the outline will be drawn on a non-planar surface and the resultant cap will also be non-planar. The volume is defined as the region between the cap and the wound bed, represented by the grey shading. The maximum depth is the longest line dropped perpendicular from the cap to the wound bed, and is represented by the blue line. The average depth is defined as the volume divided by the area. The perimeter is the length of the user-drawn outline.
Convex or superficial wounds
For convex or superficial wounds, i.e., wounds without a cavity, it is not meaningful to calculate volume or depth, but it is still meaningful to calculate area and perimeter. How the device does this is illustrated in Figure 3.
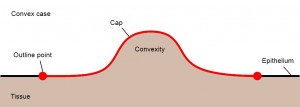
Figure 3
Figure 3: A cross-section through a convex wound. The area is defined as that region of an elastic ‘cap’ that follows the surface topology of the wound and that is circumscribed by a user-drawn outline. The outline is indicated by the two red dots and the area by the red line. The perimeter is the length of the user-drawn outline
Definitions of Terms
The following definitions apply to the measurements made for any of the physical quantities (area, perimeter, maximum depth, average depth, volume).
- Bias: The difference between the average of the measurements and the nominal value
- Bias %: Is the bias divided by the nominal value, expressed as a percentage
- Maximum error: If all the measurements are subtracted from the nominal value, the maximum error is single largest (unsigned) difference
- Maximum error %: Is the maximum error divided by the nominal value, expressed as a percentage
- Standard deviation (SD): The square root of the variance normalized by (N-1), where N is the number of measurements
- Intra-rater SD: Is the pooled standard deviation, derived from the average variance of the raters’ repeat measurements
- Intra-rater Coefficient of Variation (CV) %: Is the intra-rater SD divided by the average of the raters’ measurements, expressed as a percentage
- Inter-rater SD: Is the square root of the variance attributable to differences between raters
- Inter-rater CV %: Is the inter-rater SD divided by the average of the raters’ measurements, expressed as a percentage
- 95% Confidence Interval %: The range within which we would expect a single measurement by the same rater to be 95% of the time; it is calculated as the bias ± 1.96 × Intra-rater SD, expressed as a percentage
- Accuracy: A device that measures with high degree of accuracy has a low bias
- Precision: A device that measures with high degree of precision has low inter- and intra-rater variability
Results
The three raters made five repeated measurements on each of the four wound models, resulting in 60 unique area and perimeter measurements (3 raters by 5 repeats by 4 wounds). As there was only one model with a concavity, there were only 15 volume and depth measurements (3 raters by 5 repeats by 1 wound).
Figures 4 through 7 show graphically the measurements that were collected. For each physical quantity there is a graph displaying the actual measurements and a second graph showing the percentage errors. Note that each of the percentage error graphs have the same range on the y-axis except for depth.
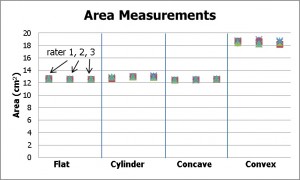 Figure 4 |
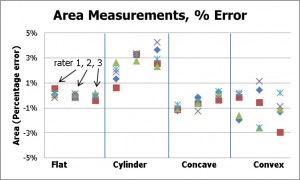 Figure 4a |
Figure 4: Area measurements for the four models and three raters: absolute measurements (left) and percentage error (right). Note that the flat, cylinder, and concave models have the same surface area (12.6 cm2) whereas the area of the convex model is larger (18.7 cm2).
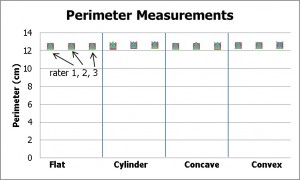 Figure 5 |
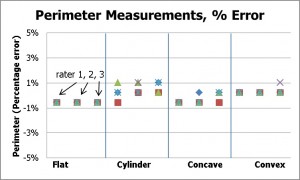 Figure 5a |
Figure 5: Perimeter measurements for the four models and three raters: absolute measurements (left) and percentage error (right).
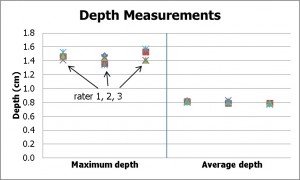 Figure 6 |
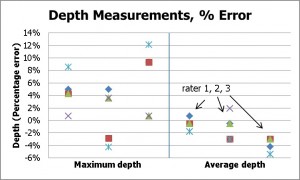 Figure 6a |
Figure 6: Depth measurements for the concave model and three raters: absolute measurements (left) and percentage error (right).
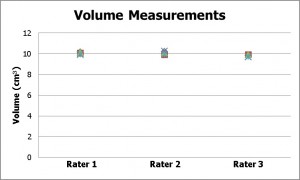 Figure 7 |
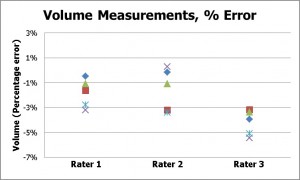 Figure 7a |
Figure 7: Volume measurements for the concave model and three raters: absolute measurements (left) and percentage error (right).
Discussion
The area measurement was seen to be very accurate, with a bias of only 0.3%, and intra- and inter-rater CV% contributions of less than 1% each. A 95% confidence level bounded by ±2%, indicates that 95% of the time we would expect a single measurement of area to be within 2% of the average value.
The measurement of perimeter was the most accurate quantity measured – with a bias of only 0.01% of the true value, and greatest error of any single measurement was only 1%.
The depth measurements showed the greatest errors of all the physical quantities, with a bias of 4% and a maximum error of 12%. However this represents an error in depth of only 1.7 mm.
The errors in volume also showed a high degree of accuracy and precision, with a bias of only -2.5%, and both intra- and inter-rater CVs of 1.4%.
A complete novice was chosen as one of the raters (rater 3) in order to introduce an element of ‘worst-case’ into the results. The novice had neither experience in wound care nor with the wound measurement device until the day of data capture. Despite this, the intra-rater variability of the results collected by rater 3 was similar to the intra-rater variability of the other two raters.
Rater 3 was, however, the biggest contributor to the inter-rater variability. For example, with reference to the percentage error of the volume measurements graph in Figure 7, rater 3’s measurements are seen to be offset from the results of the other two raters. Indeed the average of the measurements from raters 1 and 2 were different by only 0.3% (0.03 cm3). Retrospective examination of the images captured by rater 3, revealed that the additional error (around 2.5%) could be attributed to sub-optimal technique in terms of camera alignment. This amounted to a volume error of only 0.3 cm3 however.
Conclusion
From these measurements, the bias (or inaccuracy) of this device was 0.3% for area measurement, 0.01% for perimeter, up to 4% in depth and 2.5% for volume.
The repeatability (precision) associated with the three raters (inter-rater variability) and variation between repeat measurements by the same rater (intra-rater variability) were both <1% for area and perimeter, and <2% for average depth and volume. Furthermore, it was found that any single measurement is likely to be within approximately 2% for area, 1% for perimeter and 5% for average depth and volume of the measured average 95% of the time for the size of wounds that were being modeled in this study. This indicates that repeated measurements over time, even by different raters, will detect small differences as a wound changes in size and dimensions.
The error in maximum depth was higher as a percentage, although the greatest error for any depth measurement was still only 1.7 mm.
Overall, the device was found to be an accurate, non-contact method for performing measurements on wound models of this size, and was shown to measure area, depth and volume of wound models with accuracy and repeatability equivalent to another electronic wound assessment device .1-3
Future Work
Future work will present results using a wider range of wound model shapes and sizes, and temporal changes on actual wounds in the clinical setting.
Acknowledgements
The authors would like to thank statistician Dr. Chris Frampton, Associate Professor of Biostatistics, University of Otago, Christchurch, New Zealand, for his help in the preparation of the statistics.
References
1. Comparison between two methods of wound measurement on wound models: acetate tracing and a hand-held, electronic wound measurement device, Nixon M, Davey B, Fright W, McCallum B, Kieser D. Presented at the Symposium for Advanced Wound Care and Wound Healing Society Meeting (SAWC & WHS), 2009, Dallas, Texas.
2. The reliability of a handheld wound measurement and documentation device in clinical practice, Hammond C, Nixon M. Journal of Wound Ostomy Continence Nursing, 2011; 38(3): 260-264.
3. Clinical evaluation of a wound measurement and documentation system, Romanelli M, Dini V, Rogers L, Hammond C, Nixon M. Wounds, 2008, 20(9): 256-264.
Contact ARANZ Medical to find out more about how to improve wound measurement accuracy at your organization.